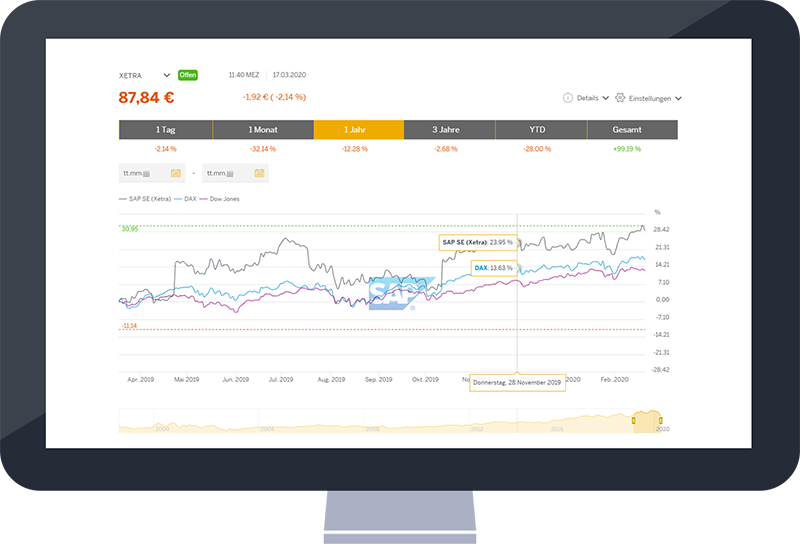
Stock Tools – Display your stock price development interactively

EQS Stock Tools offer you animated stock tools with several interactive functions. EQS Stock Tools are created using your corporate design and are easily integrated on your website.

We offer stock tools that are individualized according to your design and website requirements. You have the option of presenting your stock price development on your website in various ways:

EQS Stock Chart

Icon IR Tools Stock Chart | EQS Group

Including all functionalities, the EQS Stock Chart gives the highest level of detail about your company. The best option for your IR website.

See example

Stock Teaser

Icon IR Tools Stock Teaser | EQS Group

The Stock Teaser is smaller than the EQS Stock Chart and focuses on showing just the most important information with a simplified interface. This is usually used on IR website landing pages or the homepage, and often links to the extensive EQS Stock Chart.

Stock Price Ticker

Icon IR Tools Stock Price Ticker | EQS Group

The Stock Price Ticker is another way to easily highlight key stock information. This could be placed on your homepage.

EQS Stock Chart functions

EQS Stock Chart offers many functionalities that enhance your website user experience.

  • Time period selector
    Users can select the time period over which they want to review stock price development.
  • Benchmarks and peers
    Index or peer group data can be integrated into your chart to allow comparison of the performance of your stock against relevant indices and other industry players.
  • News integration
    Automatic integration of your company releases within the chart.
  • Multiple trading centres
    Compare the stock prices of different international trading centres.
  • Download function
    Users can download stock price data in Excel format.
  • Individual design
    The chart tool is formatted according to your existing site design to ensure seamless integration on your website.
  • Responsive Design
    The chart tool display and content automatically adapt to fit the screen size of the device viewing it.
Screen IR Tools Stock Chart | EQS Group
Request pricing

EQS Quick Analyzer – Interactive comparison of key financial figures

The EQS Quick Analyzer showcases your most important financial figures. Users can analyze key figures, compare data across financial years, and easily export data to PDF, PPT and XLS.

Features

With EQS Quick Analyzer, stakeholders can compare key financial figures. Users benefit from the following features:

Screen IR Tools Quick Analyzer | EQS Group
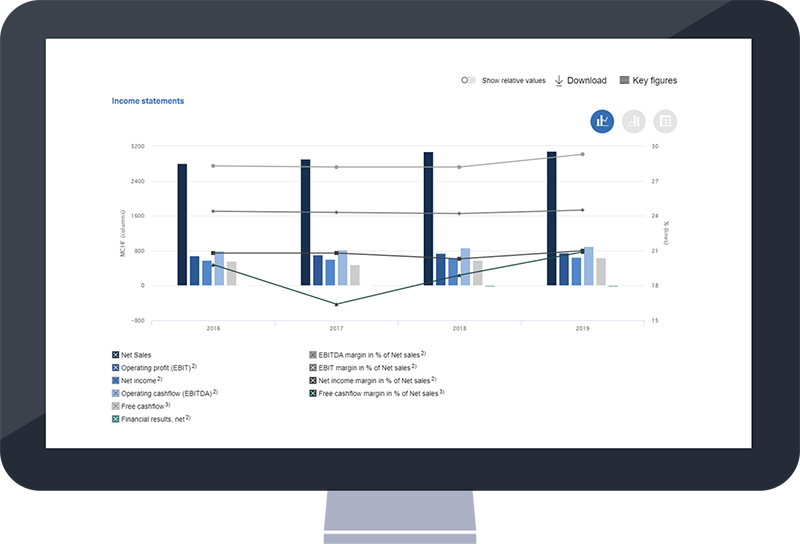
  • Intuitive interface and user guide, to assist all users irrespective of their financial knowledge and expertise.
  • Multi-year financial data comparison to analyse trends.
  • Choose from many filter options to create individual analyses.
  • Export your charts and diagrams to Excel, PDF, or PNG.
  • Intelligence within the tool assesses comparison criteria to ensure similar metrics are used across analyses.
  • Created in corporate design and with HTML 5 responsive in any browser.
Request pricing
More than 500 companies globally use our stock tools:
Reference Beiersdorf | EQS Group
Reference Gazprom | EQS Group
Reference Kingfisher | EQS Group
Reference SAP | EQS Group

More IR Tools

Exmaple news integration | EQS Group

News integration

Connect your website to our EQS Newswire and automatically display company news on your IR website.

Exmaple contact & order forms | EQS Group

Contact & order forms

Users can register to automatically receive news announcements by email as soon as they are published.

Beispiel Finanzkalender | EQS Group

Financial calendar

Automatically display your upcoming events and key publication dates.

Beispiel Event Reminder | EQS Group

Event reminder

Users can register for an email reminder to inform them of upcoming events. Reminder emails will be sent automatically, requiring no additional action from your team.

Beispiel Aktionärsstruktur | EQS Group

Shareholder structure

Provide insight on your shareholder structure with an interactive overview of your main shareholder groups.

Beispiel Renditerechner | EQS Group

Performance calculator

Users can easily and interactively calculate the return on their investment.

Beispiel Fact Sheet | EQS Group

Fact sheet

Fact Sheet is an automatically-generated PDF document summarizing all relevant information for investors, such as your company profile, management information, current share price, shareholder structure, and more. This PDF is updated automatically, daily.

Contact our expert

Marco Goldberg
Marco Goldberg

Managing Director, North America
+1 929 593 1101

Email