



INSIGHTS
Compliance reporting dashboard that proves your program works
EQS Insights is a compliance reporting dashboard that turns data from your entire compliance program into clear visualizations, peer benchmarks, and charts you can build in plain language. Your team can document program effectiveness the way DOJ guidance expects and skip the wait for a BI specialist.
Trusted by 14,000+ organizations globally








Every board report costs your compliance team a week
When the board asks for proof your program works, your team exports data from three systems and rebuilds last quarter’s charts by hand. By the time the report lands, the data is stale, and the DOJ now asks whether compliance can access and use its own data.
A compliance reporting dashboard is analytics software that consolidates data from across a compliance program, including whistleblowing cases, policy attestations, disclosures, third-party risk, and campaigns, into real-time visualizations that surface risk patterns, program performance, and audit-ready evidence. EQS Insights is the analytics module inside the EQS Compliance Cockpit. Its dashboards and AI-built charts give compliance teams unified reporting without external BI tools.
EQS Insights supports the standards your compliance program answers to
DOJ Evaluation of Corporate Compliance Programs
Track report volumes, case outcomes, and attestation rates to show your program works in practice.
Sarbanes-Oxley Act, Section 301
Give your audit committee clear reporting on how complaints about accounting and auditing matters are received and handled.
SEC whistleblower rules
Monitor case handling times and anonymity rates to build employee trust in your internal channel.
FCPA
Spot patterns in gifts, hospitality, and conflict-of-interest disclosures across regions and subsidiaries.
Business outcomes that matter
for your compliance program
Mitigate liability risks hidden in siloed data
Validate program effectiveness with evidence and peer benchmarks

Preempt potential crises before they escalate
Slash reporting overhead to focus on strategy
Why compliance leaders choose EQS Insights over generic BI tools
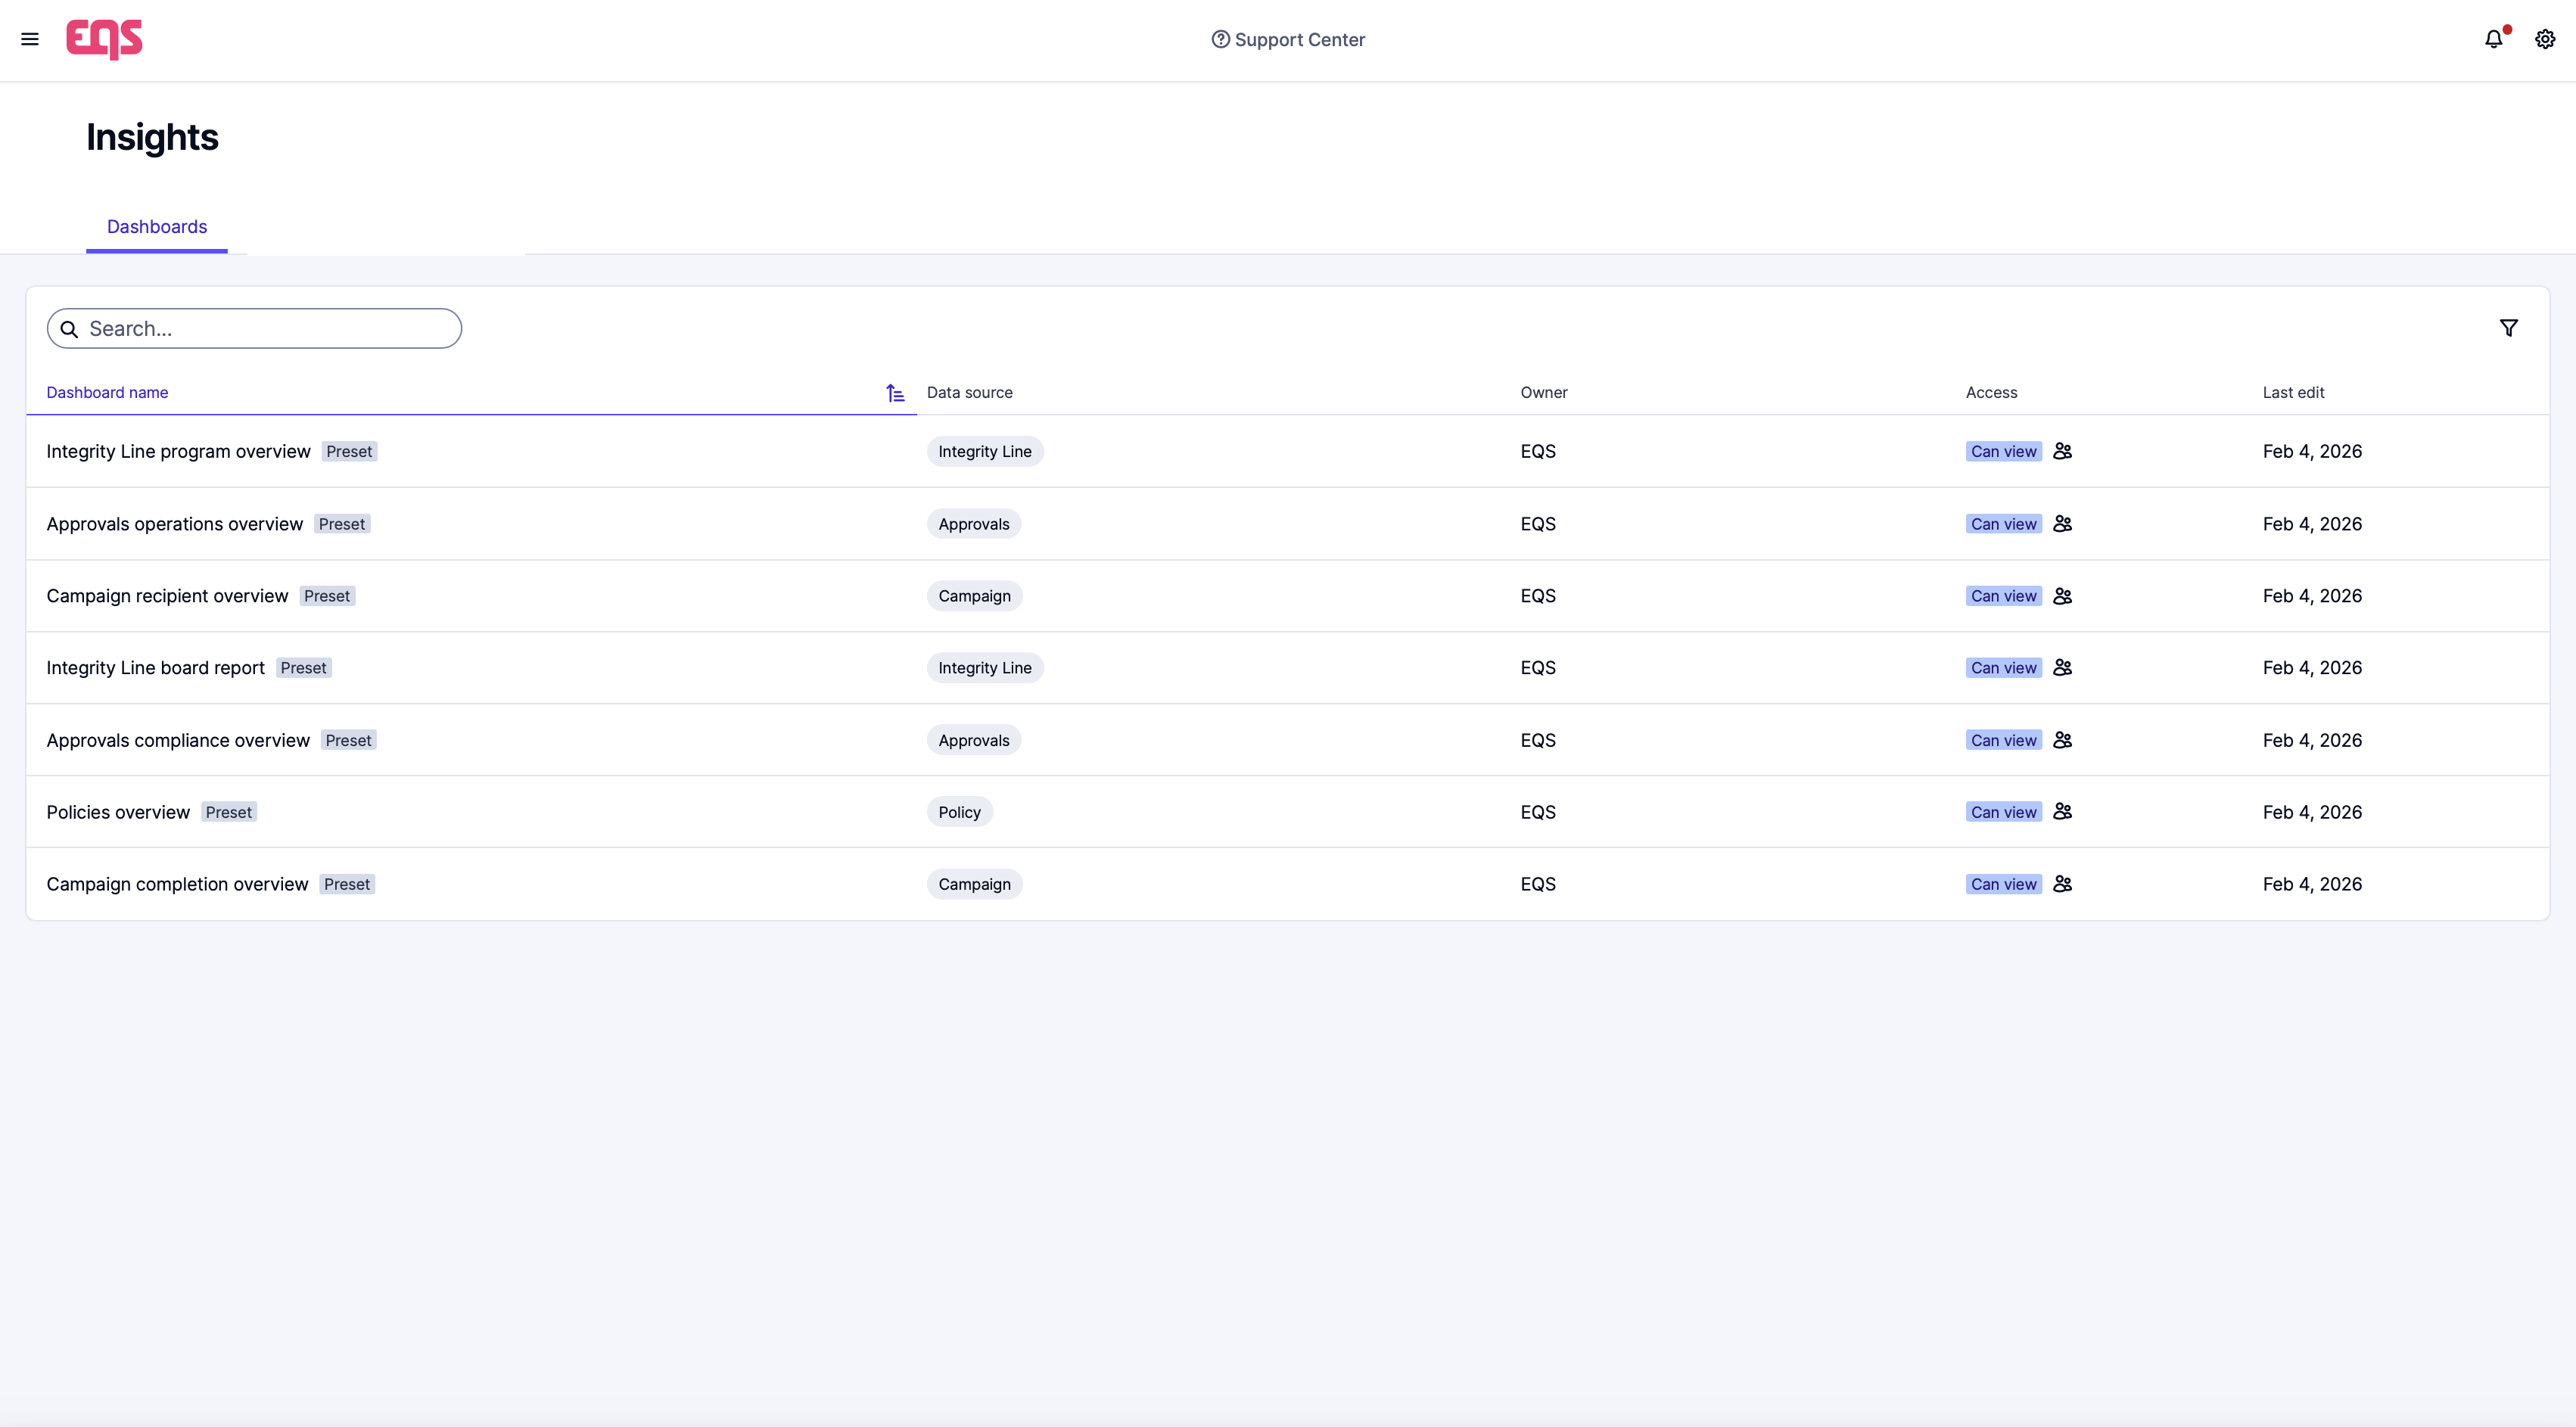
Unified view of compliance health
See the full picture by aggregating data from the Compliance Cockpit, including Integrity Line cases, policy attestations, disclosures, Third Parties, and campaigns, into a single reliable place, without a data warehouse project.
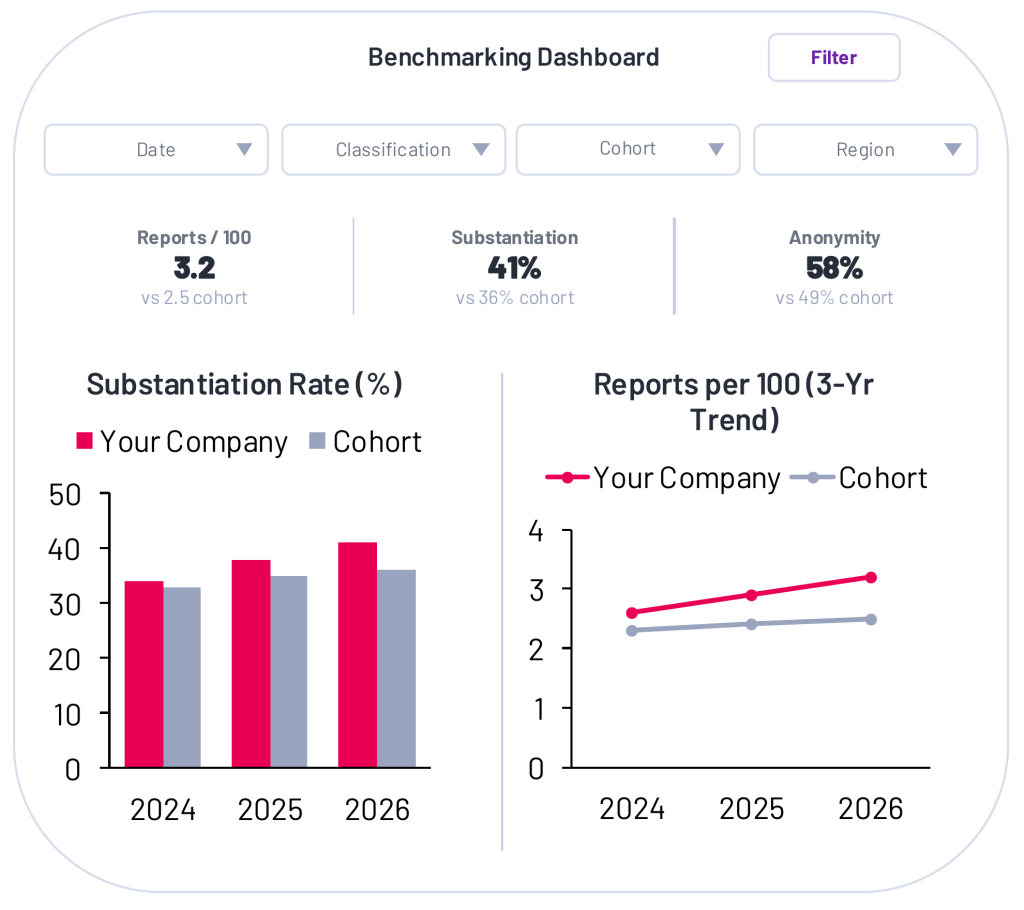
Benchmark performance against relevant peers
Compare your compliance metrics with an EQS-managed peer cohort matched on industry and company size. See whether your results are typical, improving, or need attention.
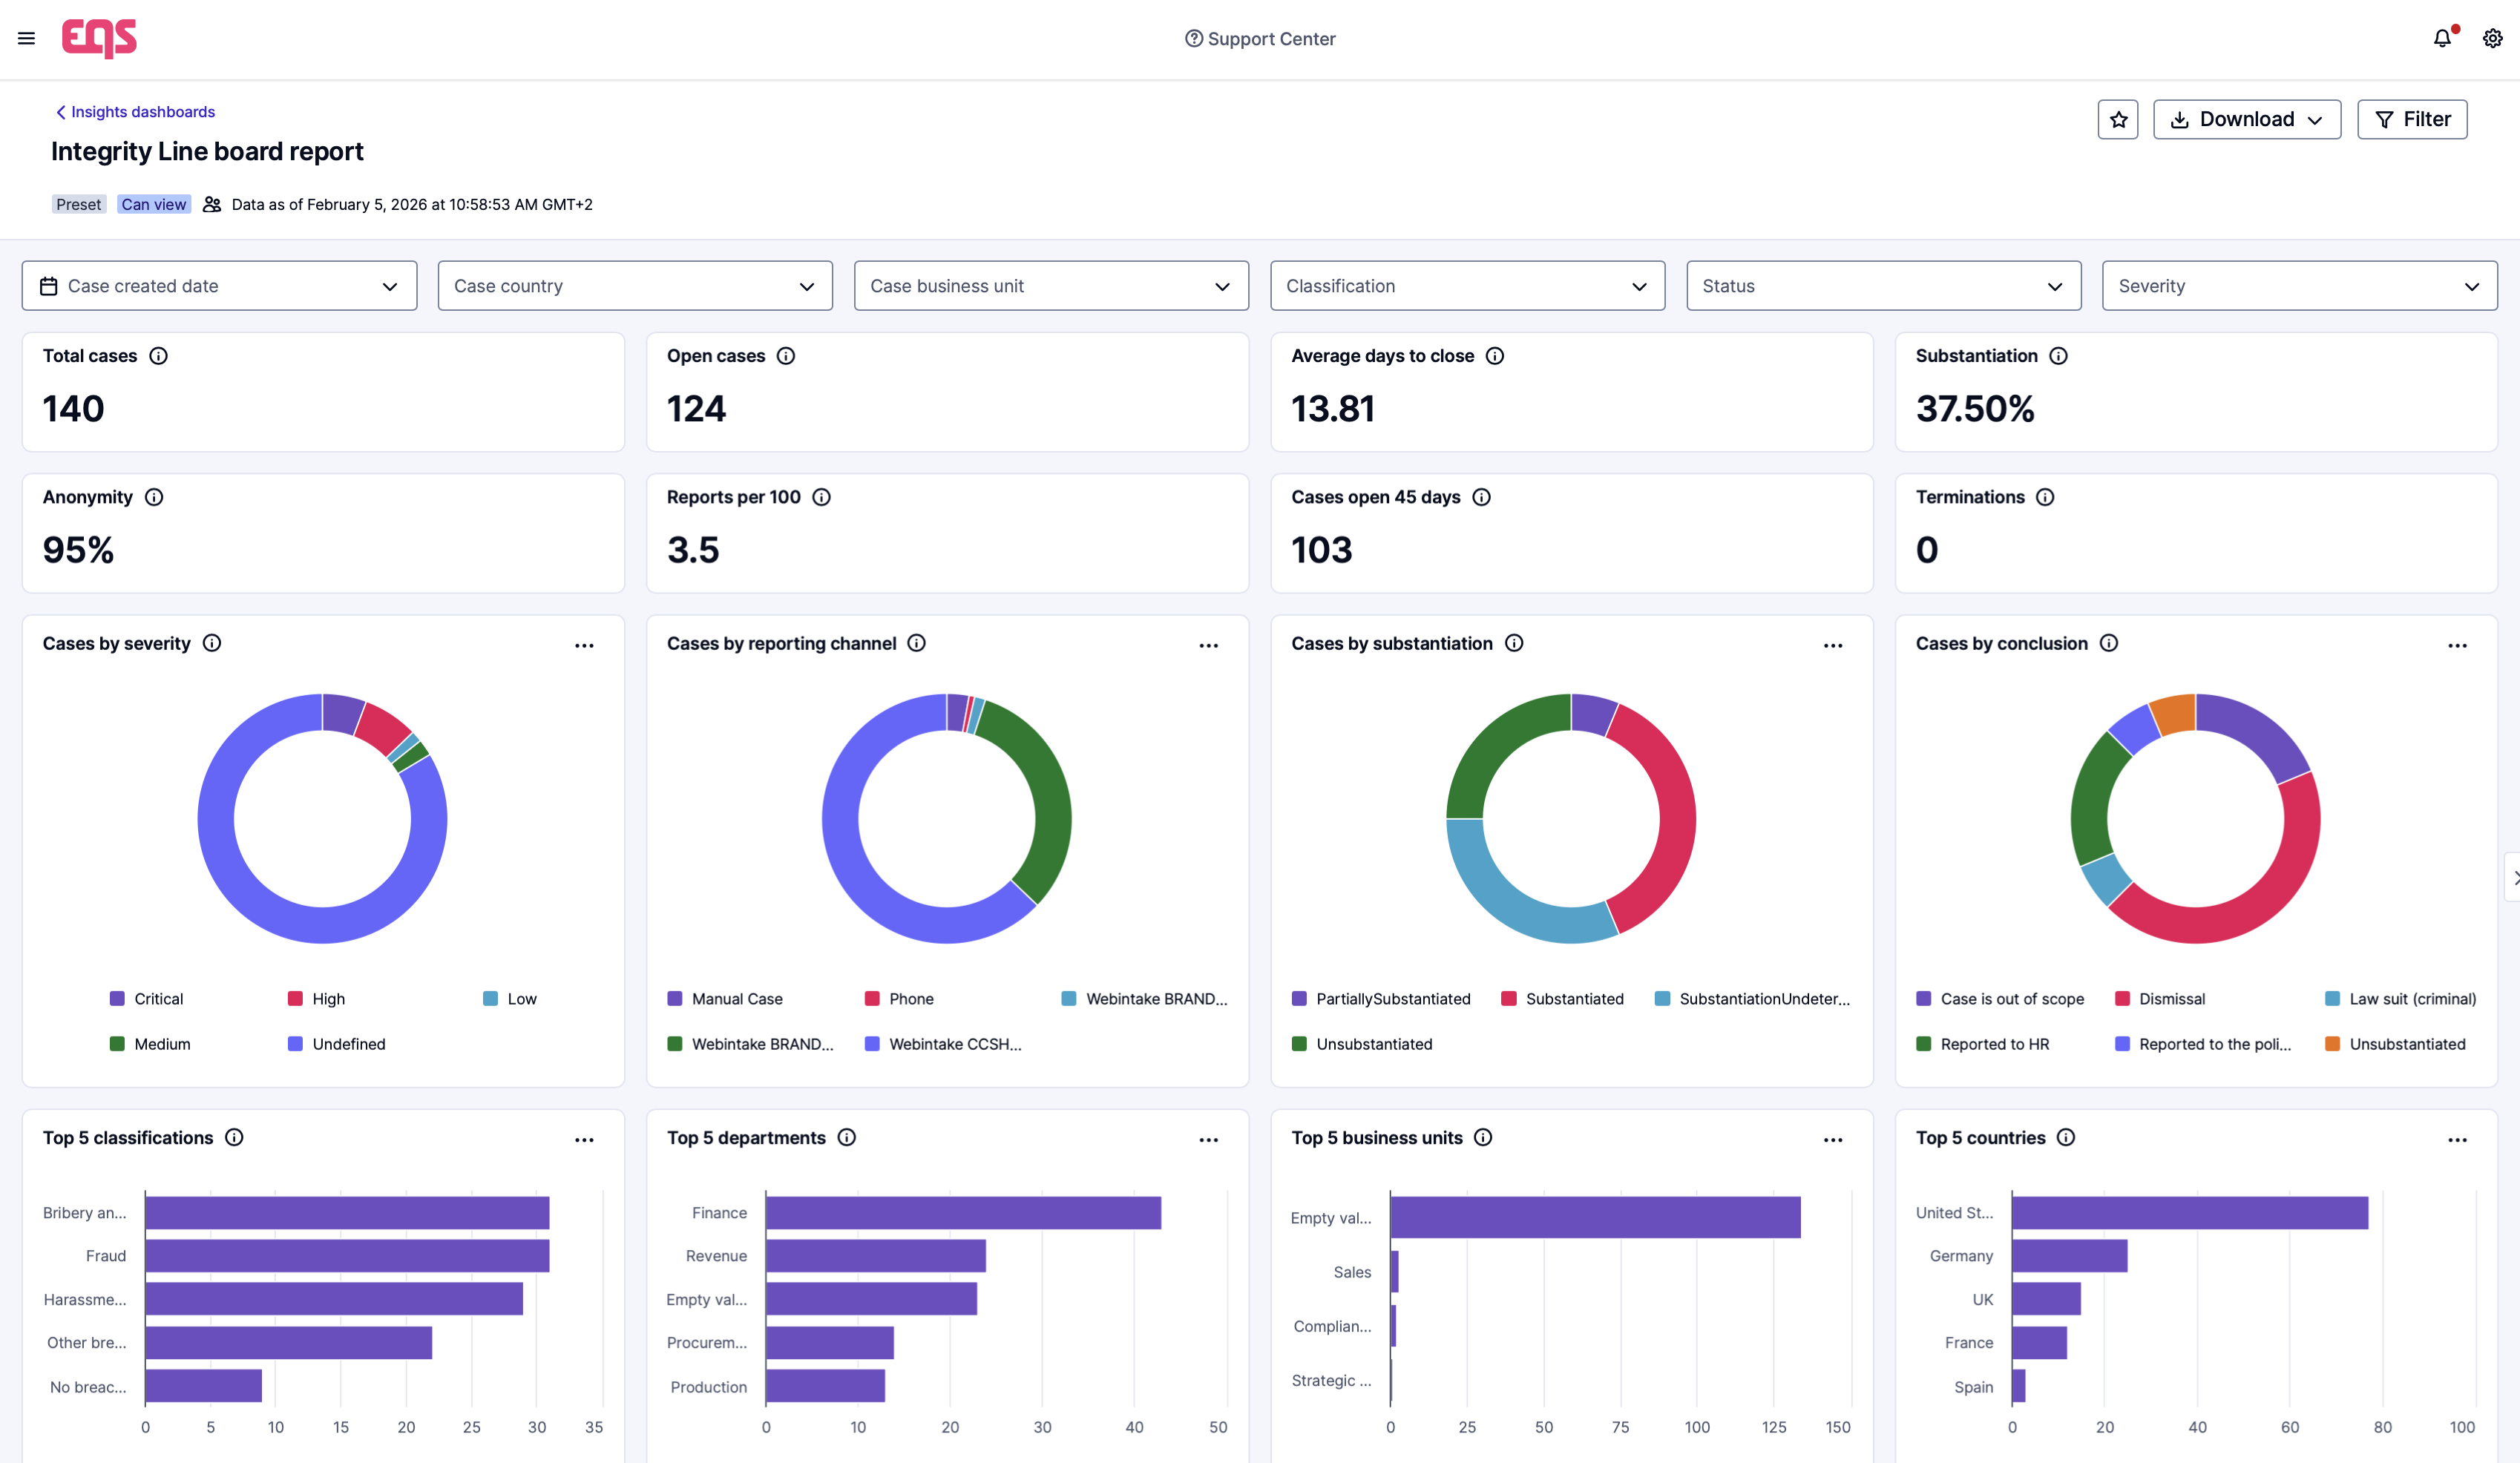
Self-serve analytics for compliance teams
Get preset, industry-standard KPIs immediately, or build custom views directly in the platform.
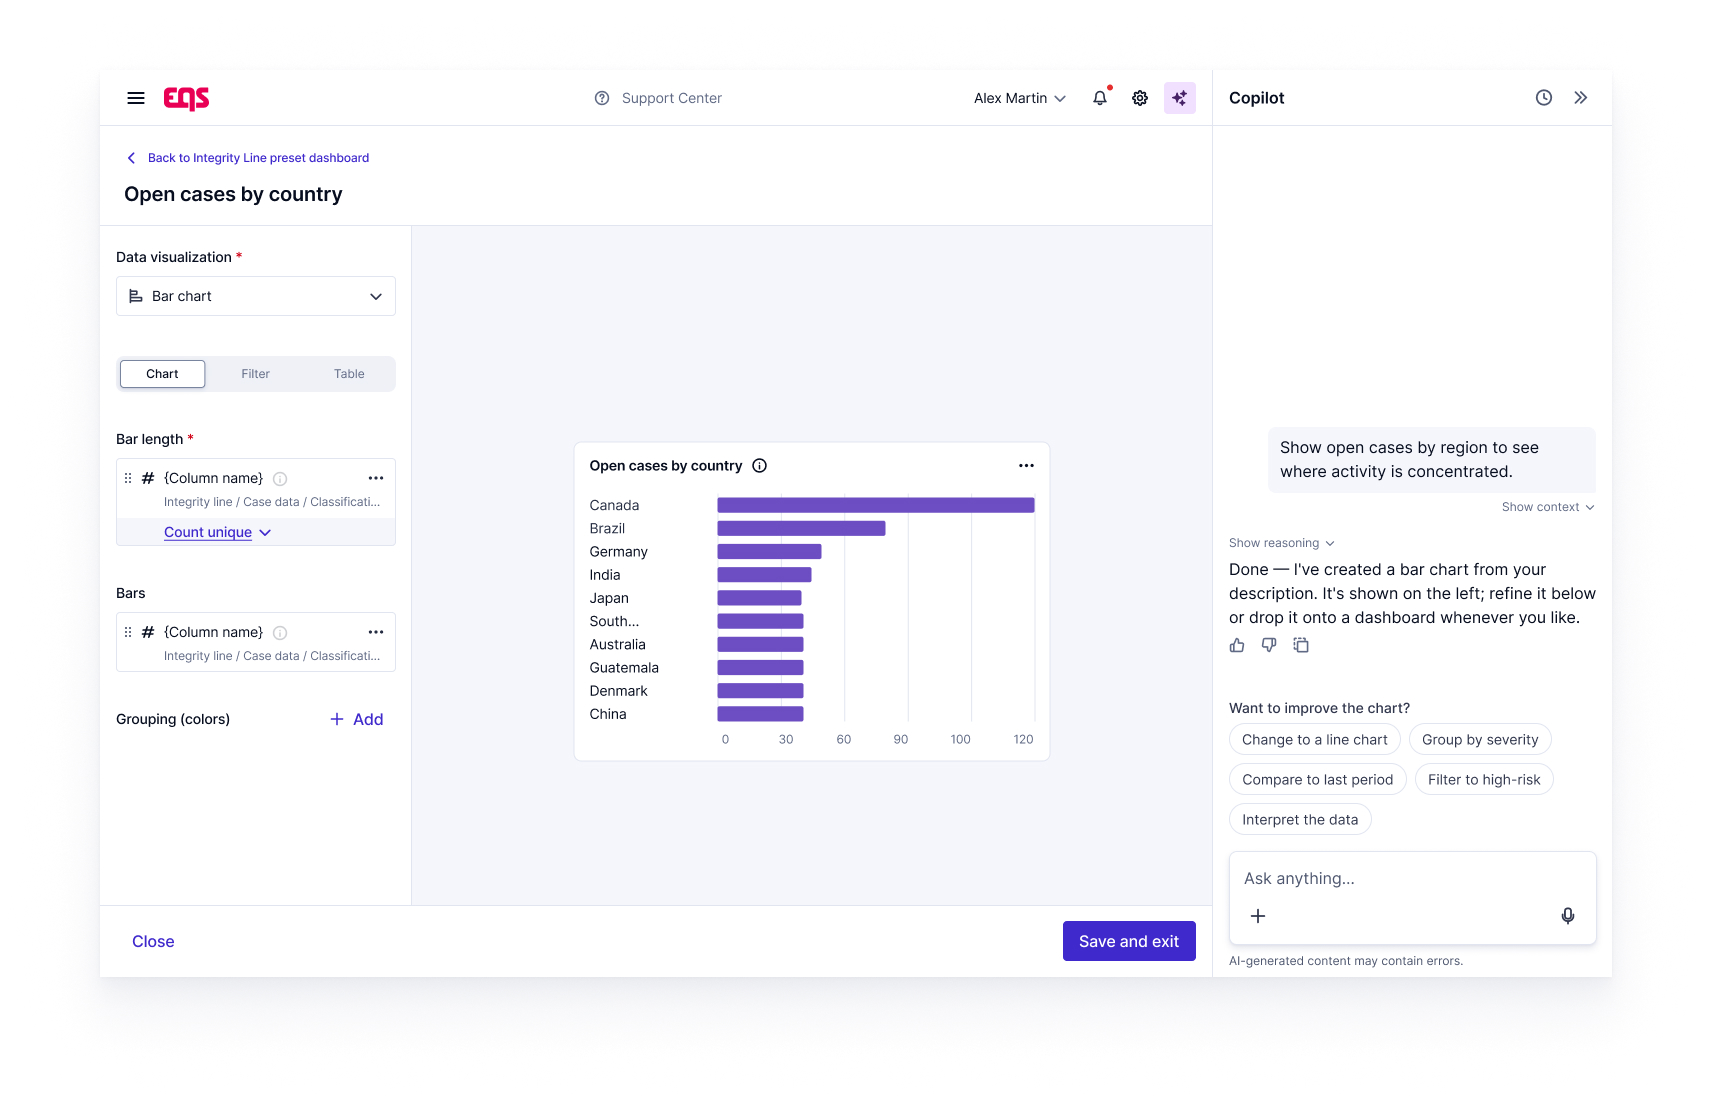
AI Chart Creation
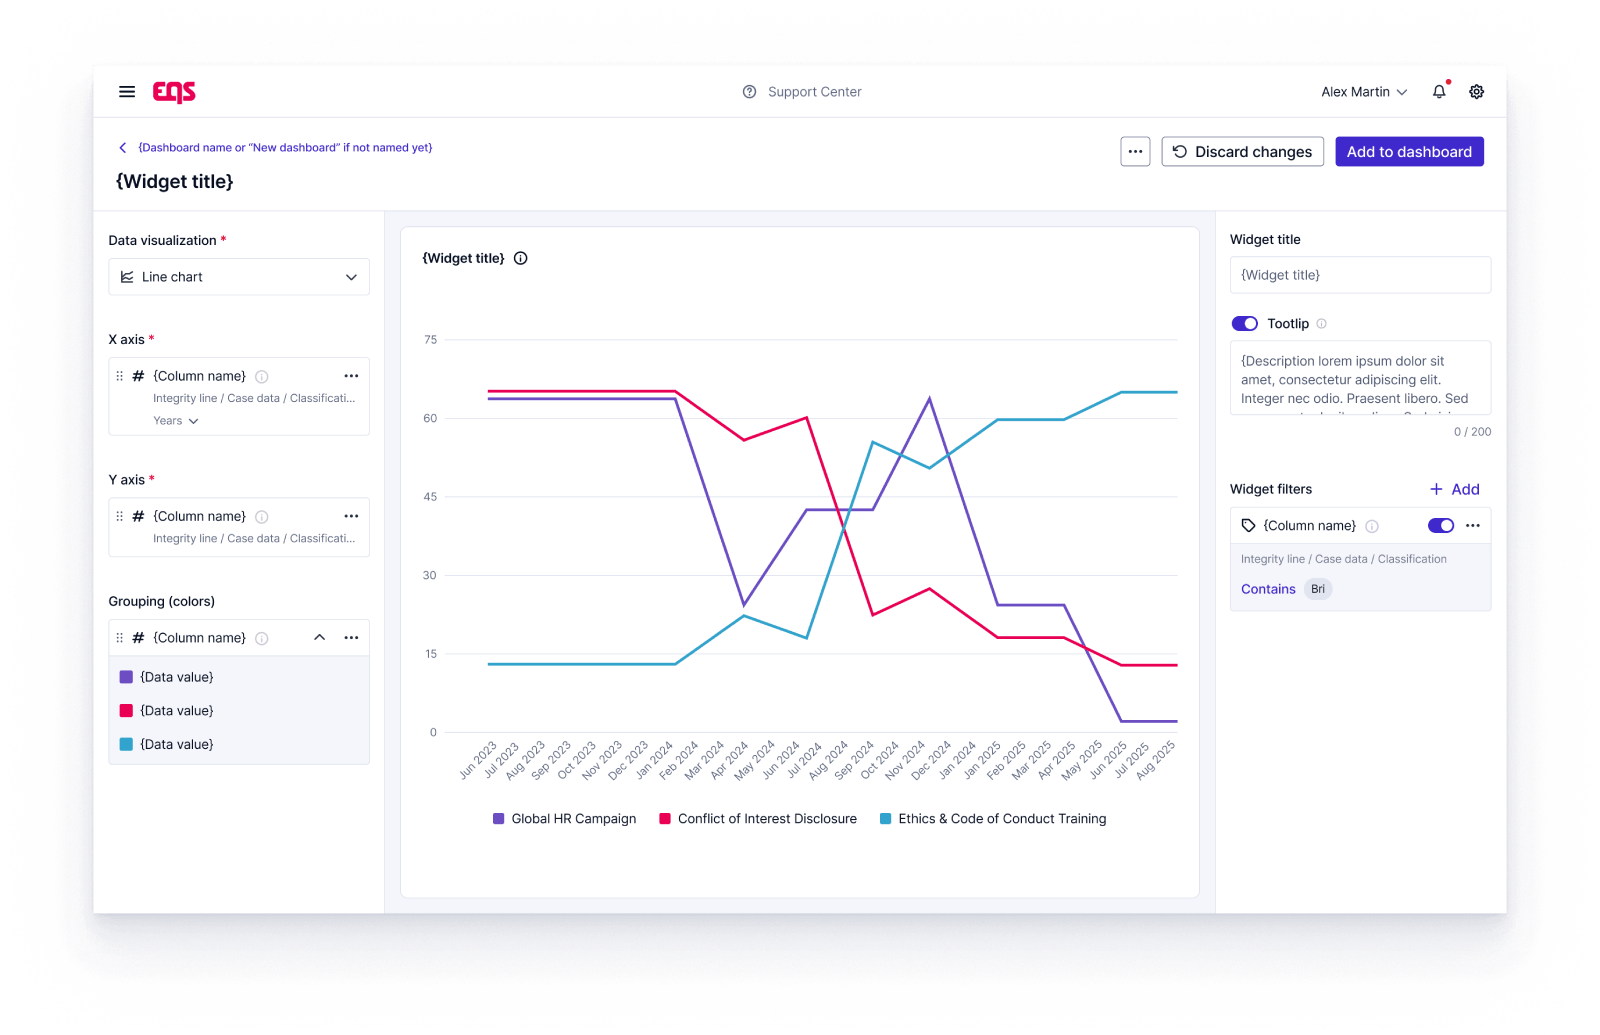
Describe the view you need in plain language, and Q by EQS builds the chart from the cases you can access. Swap a dimension or edit the legend, and the chart redraws. The standard builder stays available for manual adjustments.
 Powered by Q by EQSQ is the AI layer built into our Compliance &
Ethics solutions.
Discover Q by EQS →
Powered by Q by EQSQ is the AI layer built into our Compliance &
Ethics solutions.
Discover Q by EQS →
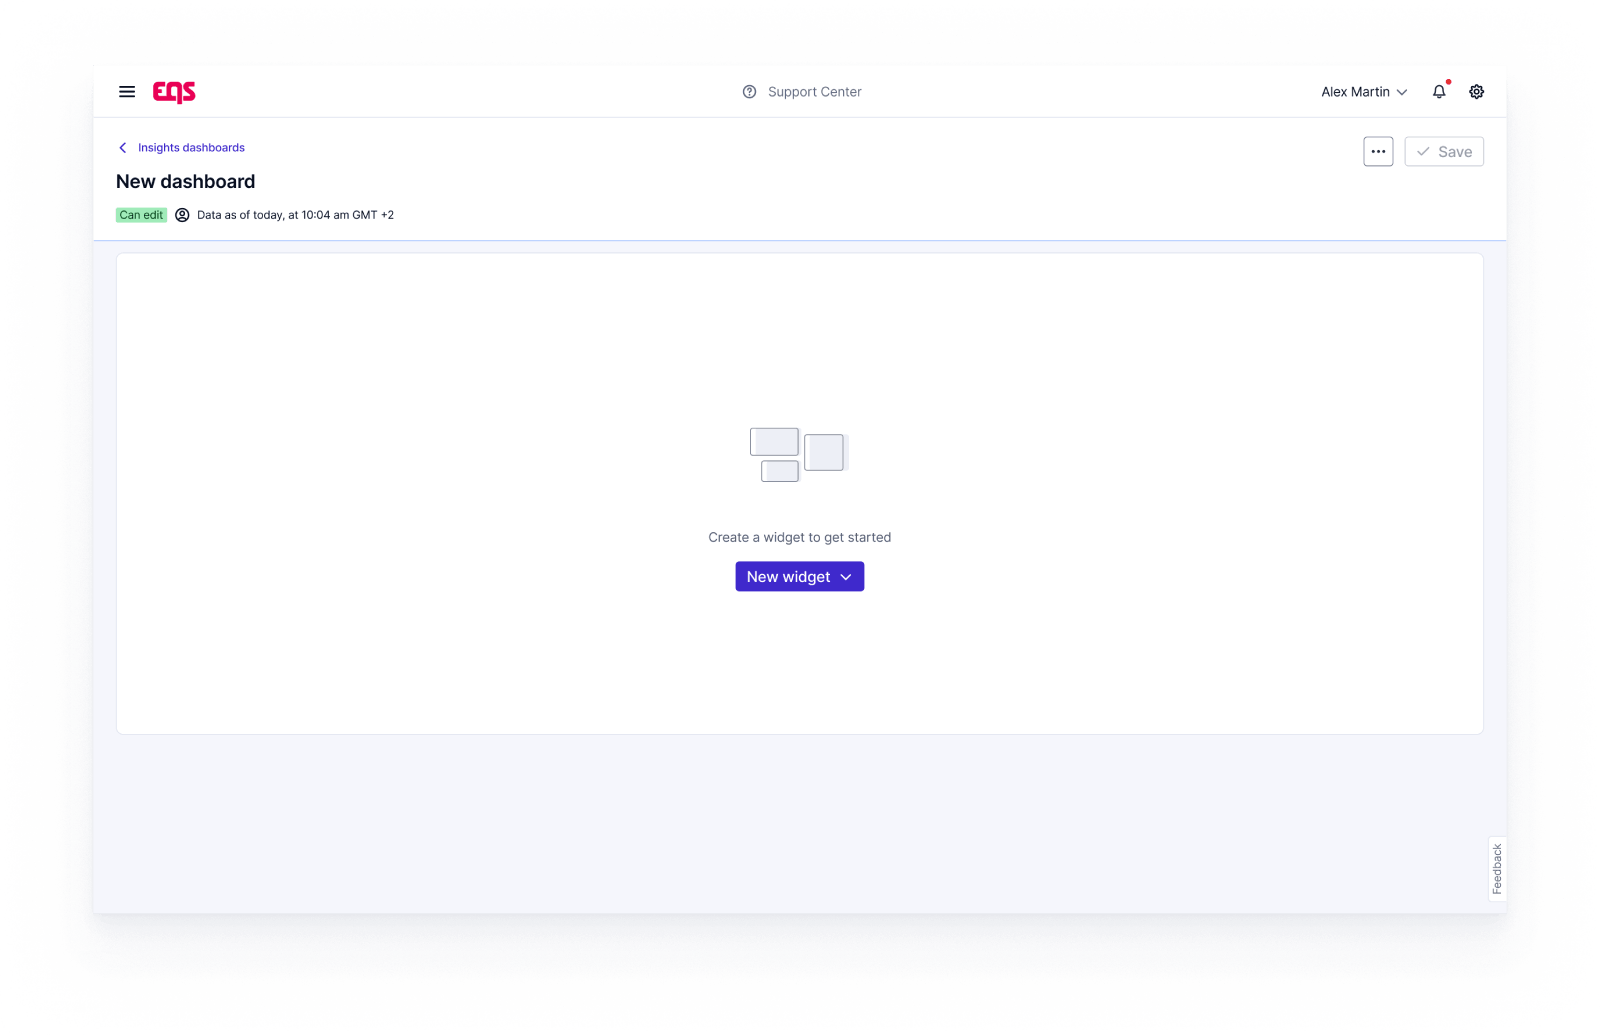
Deep investigation without the set-up
Start immediately with engineered dashboards that support deep, granular drill-downs, including custom fields. Need a specific view? Build it in the configurable dashboard builder.
Your data, in your preferred format
Whether you need a quick Excel download for a slide deck or a fully automated API feed for your corporate data lake, we support the workflow that fits your team best.
How the EQS Insights compliance reporting dashboard works
Insights is integrated with and sits at the core of the EQS Compliance Cockpit, continuously pulling data from your modules to populate role-based analytics in real time.
Access professional-grade analytics
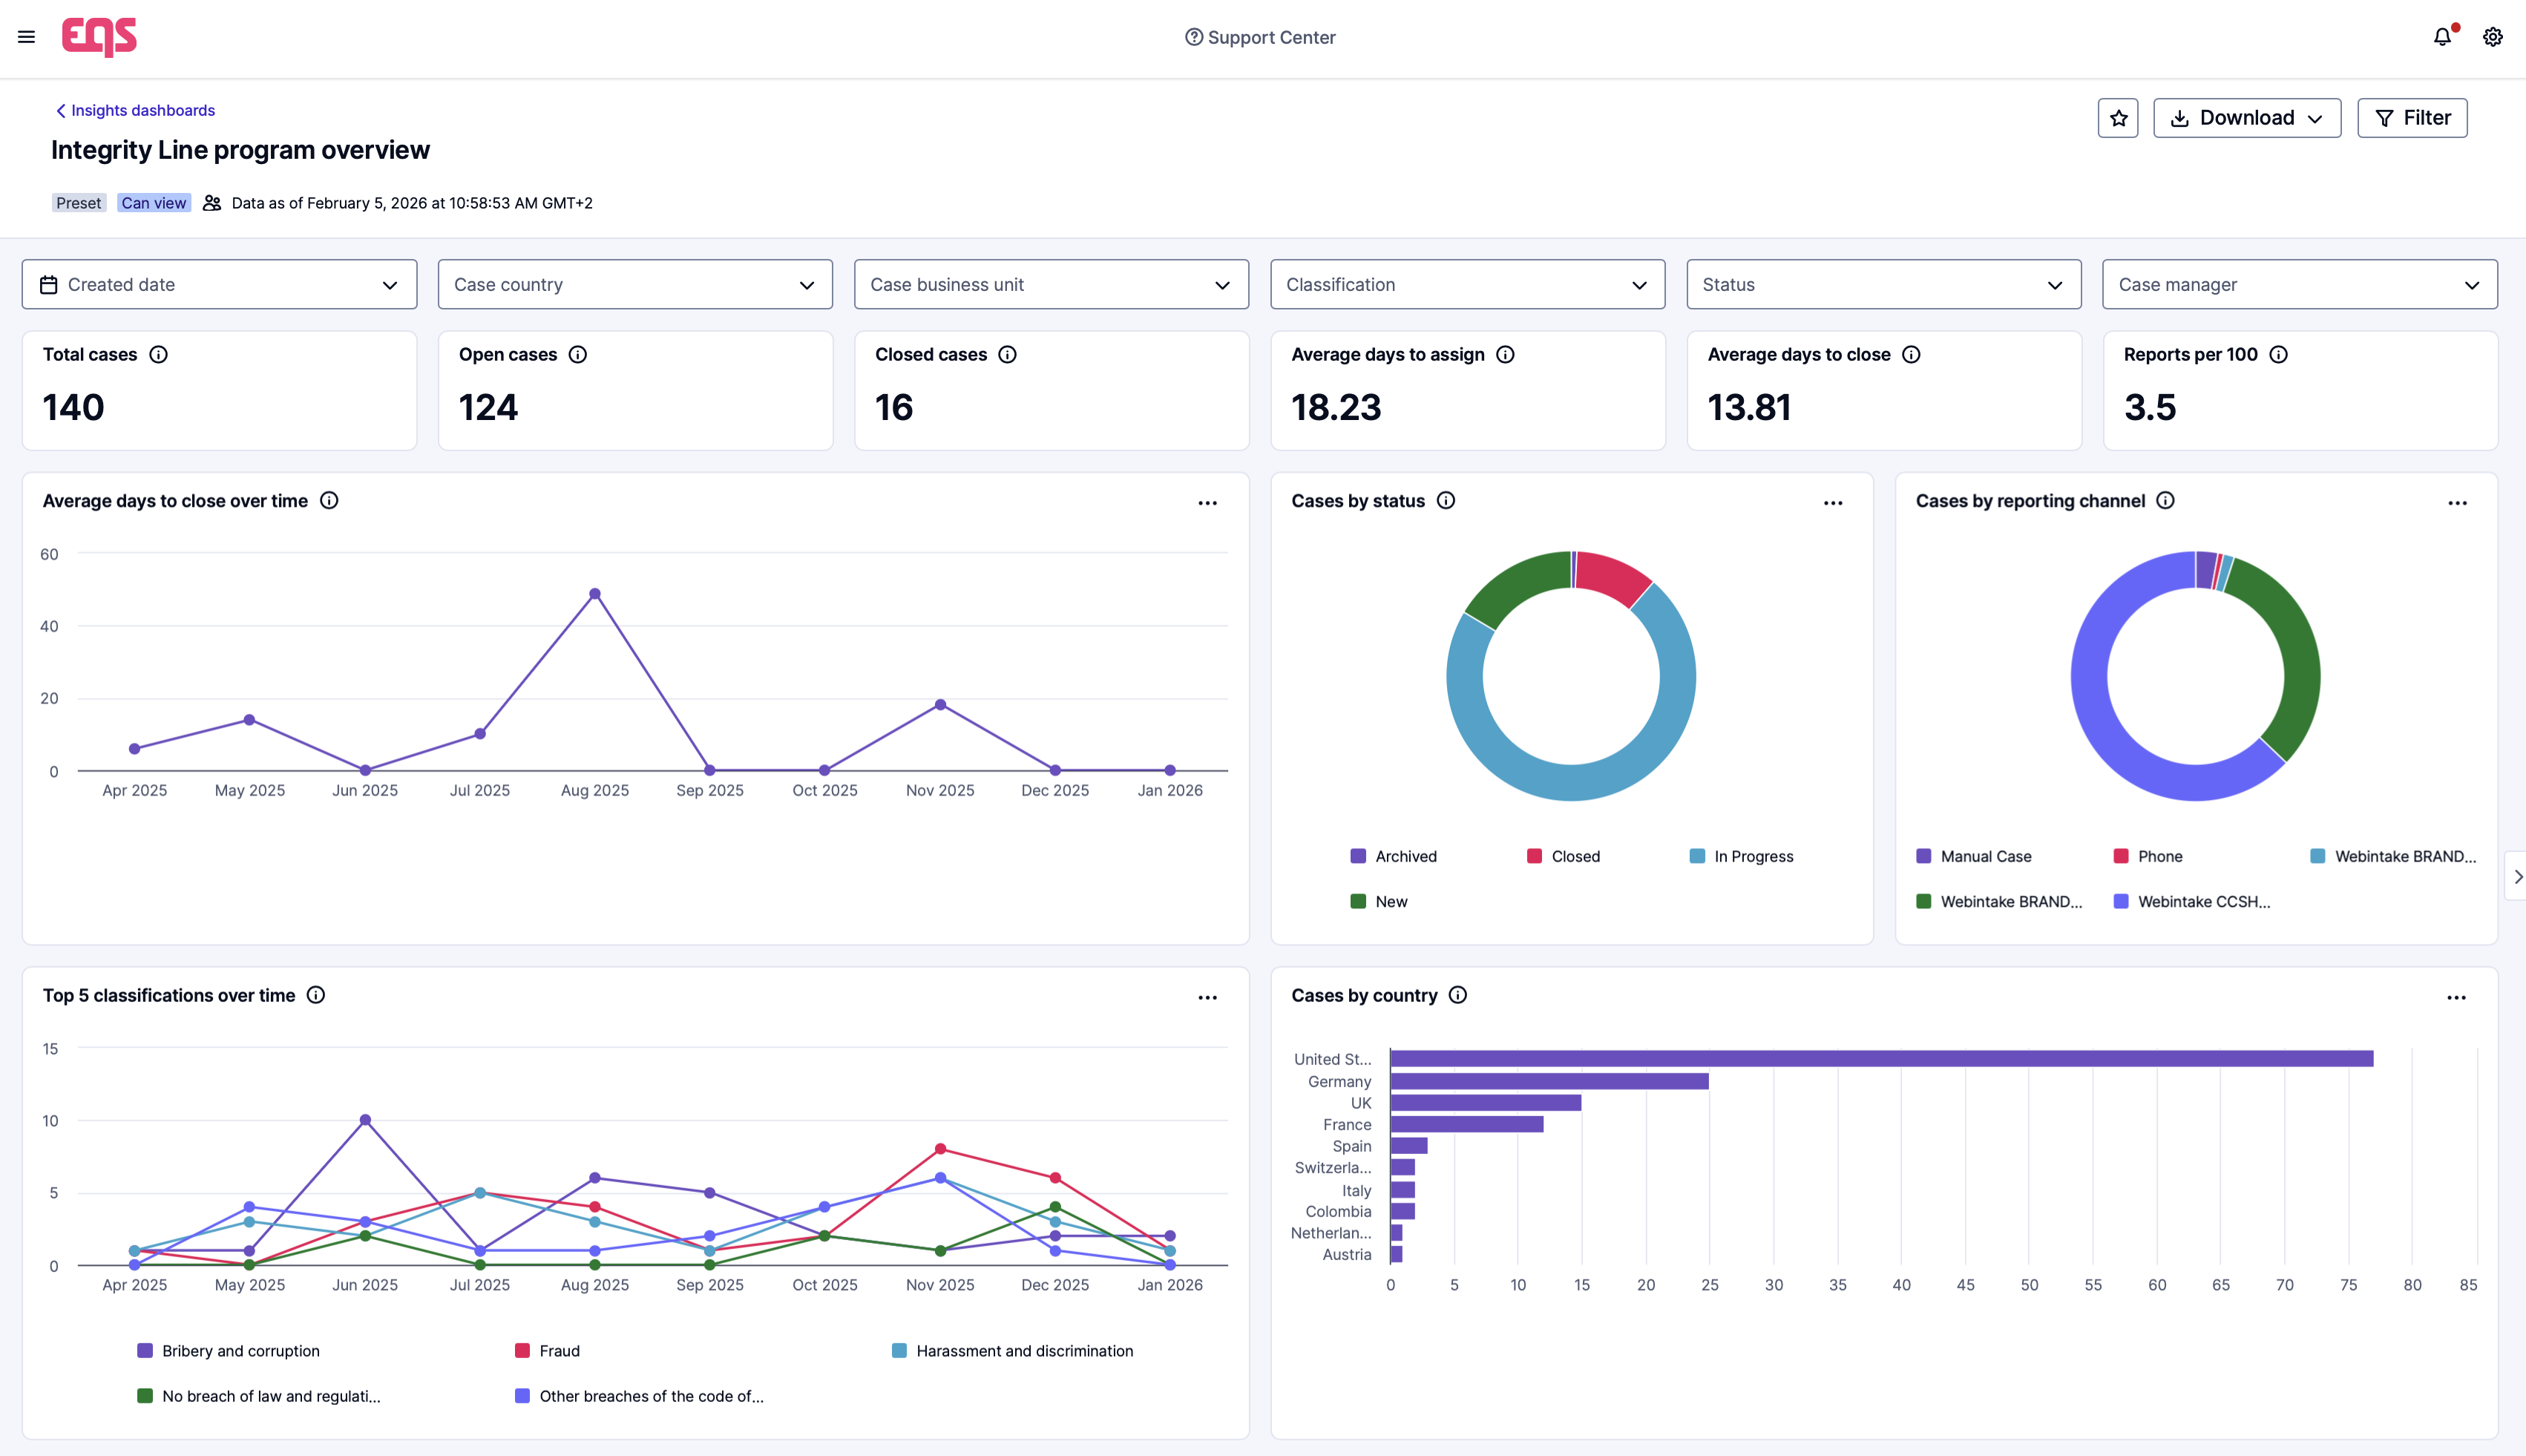
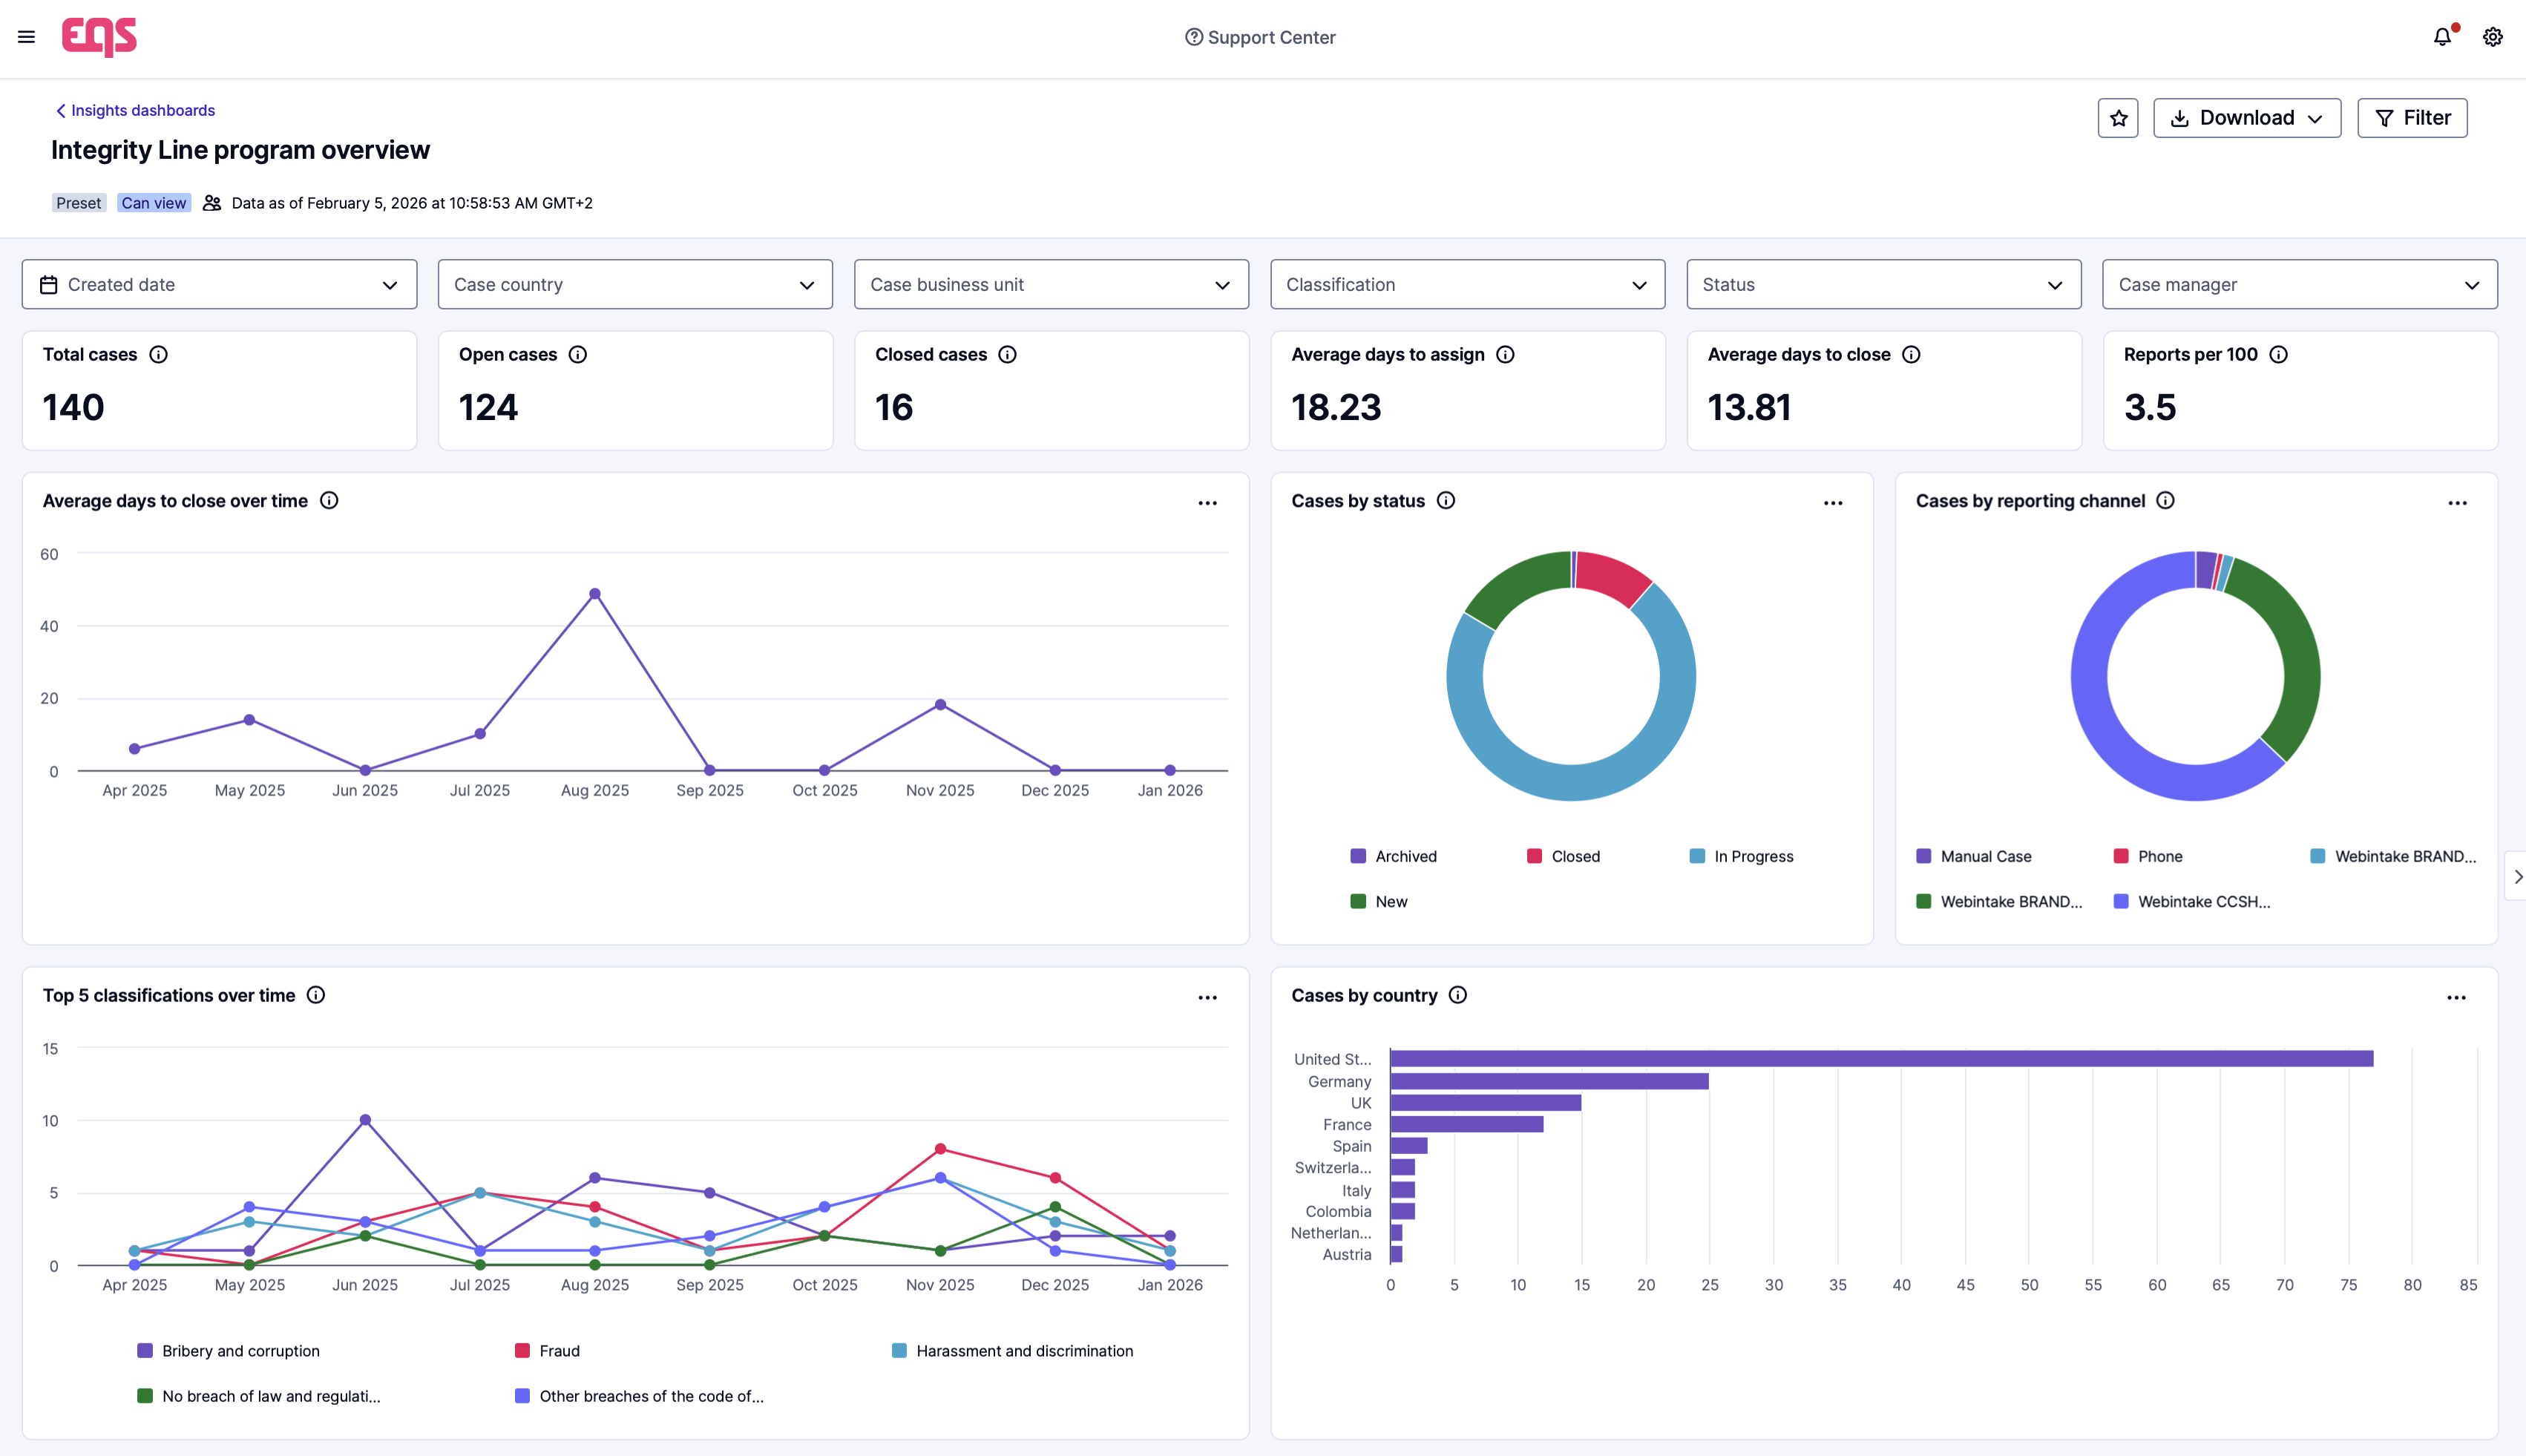
Log in and you get a high-level executive summary immediately. Our preset views display critical metrics such as Reports per 100 Employees, Anonymity Rates, and Campaign Coverage, without any set-up.
1
Investigate with granular precision
Drill down into the “why” behind the numbers. Use filters on the preset dashboards to slice data by custom fields, subsidiaries, or risk categories — solving the vast majority of your analytical needs instantly.
2
Compare performance with relevant peers
Put your results into context by comparing key compliance metrics with organizations of a similar industry, size or headquarters region. Assess where performance is typical, where it stands out and where further investigation may be needed.
3
Build custom views for unique needs
Have a unique KPI or a specific board reporting format? Use the configurable dashboard builder to create custom visualizations that match your organization’s specific strategic priorities or stakeholder preferences. With AI Chart Creation, powered by Q by EQS, you describe the view in plain language, such as “Show me concerns by type and region this quarter,” and get a working chart you can keep editing.
4
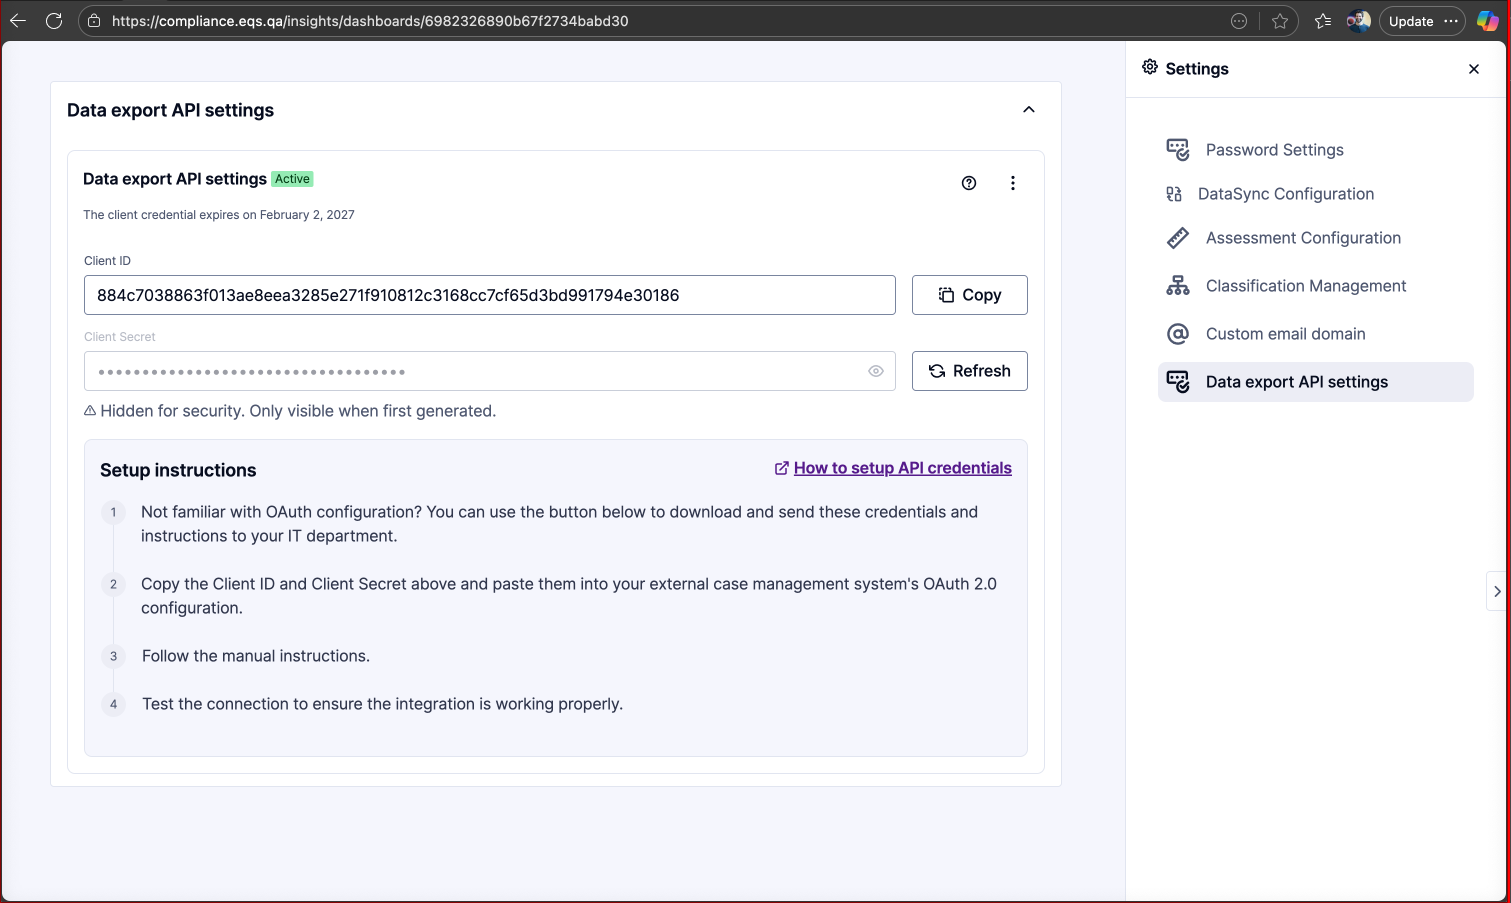
Export data your way
We support your preferred workflow. Export the entire dashboard or raw data via the UI for ad-hoc analysis or automate the flow with our secure API integration.
5
Forrester measured a 44% ROI on the EQS Compliance Cockpit
Forrester’s independent study of the EQS Compliance Cockpit found that compliance teams gained an 85% improvement in dashboard creation efficiency. The platform delivered a 44% return on investment over three years and payback in under six months. Your team puts the reclaimed hours into risk management and board strategy.
Source: Forrester Consulting, Total Economic Impact™ of EQS Compliance Cockpit, commissioned by EQS, March 2026.
Insights keeps pace with your compliance program
Whether you’re assessing program maturity, comparing performance with relevant peers, identifying ethical gaps, or reporting to your board and auditors, Insights gives you the analytics to act with confidence and stay ahead of risk.
Meet our expert

Lauren Seiss
Team Lead Sales USA
Helps US compliance teams turn their program data into clear, board-ready reporting. Talk to Lauren about your reporting needs and see how Insights fits your existing compliance program.
Schedule your consultation
with a compliance expert
Frequently Asked Questions
What types of dashboards are included?
Insights delivers preset dashboards covering key compliance KPIs, trend lines, cohort views and more, plus configurable options for tailored analysis. The dashboards aggregate data from the Compliance Cockpit: Integrity Line cases, policy attestations, disclosures, Third Parties, and campaigns.
What is a compliance reporting dashboard?
A compliance reporting dashboard gives compliance teams one place to track the metrics that show whether their program works: report volumes, case handling times, substantiation rates, policy attestation, and campaign coverage. EQS Insights provides this dashboard inside the EQS Compliance Cockpit, with preset views, peer benchmarks, and AI-built charts.
How does EQS Insights help show the DOJ that a compliance program is effective?
The DOJ’s Evaluation of Corporate Compliance Programs asks prosecutors to assess whether a program works in practice and whether compliance staff can access the data they need to monitor and test it. EQS Insights gives compliance teams direct access to their program data, with trend lines, drill-downs, and peer benchmarks they can export as evidence for the board, auditors, or regulators.
Do I need to build custom reports to drill down into data?
No. EQS Insights preset dashboards include filters to slice data by custom fields, subsidiaries, and risk categories without building anything new.
Can I export data outside the platform?
Yes. EQS Insights exports raw data and formatted reports directly from the user interface or set up an API connection for automated workflows and integrations.
How do you handle data security and anonymity?
Insights adheres to the same ISO 27001 certified security standards as the Compliance Cockpit. Insights shows each user only the data they can already open in the Cockpit, based on their role permissions. Anonymous reports stay anonymous. Q by EQS follows the same rules: it reads only what the logged-in user can open, and every AI action appears in the platform audit trail.
Do I need BI skills to use Insights?
No. Insights is designed to be accessible to compliance professionals without specialized BI expertise. With AI Chart Creation, powered by Q by EQS, you describe the chart you need in plain language and refine it from there.
Can I benchmark my compliance program against other organizations?
Yes. EQS Insights enables you to compare selected compliance metrics with an EQS-managed peer cohort based on criteria such as industry and company size.
How is the peer benchmark created?
Benchmark data is drawn from EQS’s broad global customer base and grouped into relevant cohorts. The aggregated results help organizations understand whether their performance is typical or unusual without revealing the data of individual companies.
Which metrics can I benchmark?
Benchmarking covers selected key compliance metrics available within Insights. The exact metrics and available peer cohorts may depend on the underlying data and the organization’s use of the EQS Compliance Cockpit.
Can I create charts with AI?
Yes. AI Chart Creation, powered by Q by EQS, builds charts in configurable dashboards from plain-language requests. Q checks the available fields, renders an editable chart, and redraws it when you swap a dimension or change the legend. Charts draw only on cases you have permission to access, and admins can switch the feature on or off for the whole organization or for specific users.
Do I need a technical implementation team to set this up?
No technical set-up is required for the standard dashboards. Because Insights is native to the Compliance Cockpit, your data flows automatically as soon as you start using the modules. API integrations for external BI tools may require coordination with your IT team.
What specific KPIs are tracked out of the box?
We pre-load the most requested industry metrics, including Average Case Handling Time, Reports per 100 Employees, Substantiation Rates, Policy Attestation percentages, and Approval bottlenecks.
Can I see campaigns, policies, disclosures, and Third Parties data all in one place?
Yes, within Preset Dashboards you can see aggregated reports from all compliance modules, including Third Parties.